Published in Personal Injury on January 16, 2017
As part of our commitment to safety in our community, the team at Douglas Haun Heideman wanted to identify the most dangerous intersections in the state of Missouri.
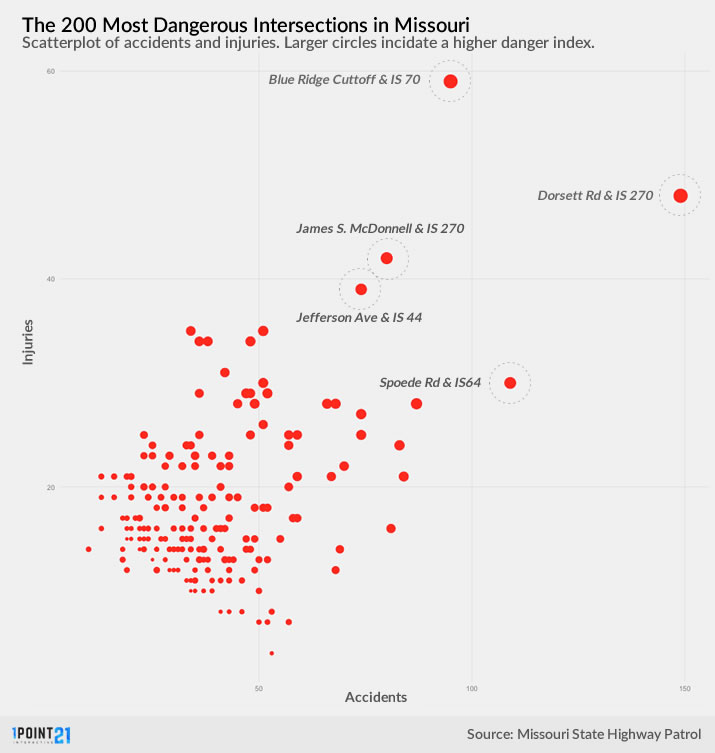
With the help of data visualization agency 1point21 Interactive, we analyzed over 148,000 collision records from the Missouri State Highway Patrol to find the 200 most dangerous intersections in our state. The data analysis team looked at total accidents, injuries and fatalities in order to assign a collision danger index (CDI) to each intersection.
Below are the results of our study.mshp.dps.missouri.gov/MSHPWeb/Root
*Colloquial names and references to roads may be different than how they appear in the official records (for example, William Street in Cape Girardeau is referred to here as Route K, while Interstates are labeled IS followed by the number).
The Most Dangerous Intersections in Missouri
| City | Road 1 | Road 2 | Crashes | Injured | Killed | Danger_Index |
|---|---|---|---|---|---|---|
| MARYLAND HEIGHTS | DORSETT RD | IS 270 | 149 | 48 | 0 | 293 |
| KANSAS CITY | BLUE RIDGE CUTOFF | IS 70 | 95 | 59 | 1 | 282 |
| HAZELWOOD | JAMES S MCDONNELL BLVD | IS 270 | 80 | 42 | 0 | 206 |
| FRONTENAC | SPOEDE RD | IS 64 | 109 | 30 | 0 | 199 |
| ST LOUIS | JEFFERSON AVE | IS 44 | 74 | 39 | 0 | 191 |
| KANSAS CITY | FRONT ST | IS 435 | 87 | 28 | 1 | 181 |
| BERKELEY | AIRPORT RD | IS 170 | 51 | 35 | 0 | 156 |
| FENTON | GRAVOIS BLUFFS BLVD | MO 141 | 74 | 27 | 0 | 155 |
| KANSAS CITY | HOLMES RD | IS 435 | 83 | 24 | 0 | 155 |
| KANSAS CITY | GREGORY BLVD | US 71 | 68 | 28 | 0 | 152 |
| ST JOSEPH | BELT HWY | FARAON ST | 48 | 34 | 0 | 150 |
| RICHMOND HEIGHTS | ERM EAST IS 64 MILE 326 | IS 64 | 66 | 28 | 0 | 150 |
| ST LOUIS | SALISBURY ST | IS 70 | 52 | 29 | 1 | 149 |
| KANSAS CITY | BANNISTER RD | US 71 | 74 | 25 | 0 | 149 |
| ST LOUIS | KINGSHIGHWAY BLVD | IS 64 | 84 | 21 | 0 | 147 |
| KANSAS CITY | 59TH ST | US 71 | 47 | 29 | 1 | 144 |
| ST PETERS | MID RIVERS MALL DR | IS 70 | 49 | 28 | 1 | 143 |
| ST LOUIS | GRAND AVE | IS 70 | 51 | 30 | 0 | 141 |
| ST LOUIS | HAMPTON AVE | IS 64 | 51 | 30 | 0 | 141 |
| SPRINGFIELD | CAMPBELL AVE | WALNUT LAWN ST | 38 | 34 | 0 | 140 |
| ST LOUIS | BIRCHER BLVD | UNION BLVD | 34 | 35 | 0 | 139 |
| ST LOUIS | PARK AVE | IS 55 | 36 | 34 | 0 | 138 |
| KANSAS CITY | 87TH ST | IS 435 | 70 | 22 | 0 | 136 |
| CLAYTON | BRENTWOOD BLVD | IS 170 | 42 | 31 | 0 | 135 |
| INDEPENDENCE | LEES SUMMIT RD | IS 70 | 48 | 29 | 0 | 135 |
| LIBERTY | BLUE JAY DR | KANSAS ST | 59 | 25 | 0 | 134 |
| ST LOUIS | HAMPTON AVE | IS 44 | 57 | 25 | 0 | 132 |
| KANSAS CITY | EMANUEL CLEAVER II BLVD | US 71 | 59 | 21 | 1 | 132 |
| KANSAS CITY | 75TH ST | US 71 | 67 | 21 | 0 | 130 |
| ST LOUIS | ADELAIDE AVE | IS 70 | 45 | 28 | 0 | 129 |
| KANSAS CITY | BANNISTER RD | IS 435 | 51 | 26 | 0 | 129 |
| CLAYTON | FOREST PARK PKWY | IS 170 | 57 | 24 | 0 | 129 |
| CAPE GIRARDEAU | MT AUBURN RD | RT K | 81 | 16 | 0 | 129 |
| BERKELEY | NORTH HANLEY RD | IS 70 | 36 | 29 | 0 | 123 |
| FERGUSON | WEST FLORISSANT AVE | SOR 270 | 48 | 25 | 0 | 123 |
| KANSAS CITY | BLUE RIDGE BLVD | IS 470 | 57 | 20 | 0 | 117 |
| ST LOUIS | SHREVE AVE | IS 70 | 35 | 23 | 1 | 114 |
| DELLWOOD | CHAMBERS RD | WEST FLORISSANT AVE | 43 | 23 | 0 | 112 |
| ST JOSEPH | BELT HWY | MITCHELL AVE | 36 | 25 | 0 | 111 |
| VALLEY PARK | IS 44 | MO 141 | 69 | 14 | 0 | 111 |
| KIRKWOOD | BIG BEND BLVD | IS 270 | 59 | 17 | 0 | 110 |
| RAYTOWN | GREGORY BLVD | MO 350 | 43 | 22 | 0 | 109 |
| KANSAS CITY | WORNALL RD | IS 435 | 58 | 17 | 0 | 109 |
| ST LOUIS | PAGE BLVD | UNION BLVD | 39 | 23 | 0 | 108 |
| ST LOUIS | UNION BLVD | IS 70 | 29 | 23 | 1 | 108 |
| LIBERTY | CONISTOR RD | KANSAS ST | 41 | 22 | 0 | 107 |
| KANSAS CITY | BLUE PKWY | IS 435 | 34 | 24 | 0 | 106 |
| KANSAS CITY | RED BRIDGE RD | US 71 | 52 | 18 | 0 | 106 |
| ST JOSEPH | BELT HWY | FREDERICK AVE | 33 | 24 | 0 | 105 |
| KANSAS CITY | EASTWOOD TRFY | IS 435 | 51 | 18 | 0 | 105 |
Key Findings
- Dorsett Road and I-270 in Maryland Heights, based on collision volume and severity, is the most dangerous intersection in Missouri. Interestingly, it uses a “diverging diamond” interchange (DDI), which is purported to be safer, cheaper and an overall improvement to traffic operations when compared to straight roads. The 6th most dangerous intersection – Front Street and I-435 in Kansas City – uses a DDI as well. *More on DDI’s below.
- Kansas City and St. Louis each had a total of 45 intersections make the 200 most dangerous list, tied for the most of any city. However, four of the ten most dangerous intersections were found in Kansas City, while only one of the top ten were in St. Louis.
- More than 200,000 vehicles pass through Blue Ridge Cutoff and I-70 in Kansas City per day; this intersection led the way as the site of the most injuries from crashes (59).
- Columbia, the 4th most populous city in Missouri, had the 6th most injuries stemming from car crashes of all cities in our study. Yet no intersection in Columbia appears here.
- Country Club Hills, with a population of 1,272, is the smallest city to have an intersection on the list. West Florissant Avenue and Route U came in as the 56th most dangerous intersection in Missouri.
- There are more than 5 million registered vehicles in the state of Missouri, and some intersections don’t have the infrastructure to handle the current vehicle volume.
- Gimblin Road and Hall Street in St. Louis had the fewest accidents of any intersection, but tied with three other intersections for the most fatalities due to one tragic accident.
- Even within our index, intersections at the top and bottom are markedly different in terms of safety. Intersections in the top 25 (most dangerous) averaged more than twice as many collisions (66.4 compared to 31.96) and nearly three times as many injuries as the bottom 25 on our list (29.04 vs 12).
Cities with Two or More Intersections in the Top 200
Dorsett Road & I-270: Dawn of The DDI
As mentioned above, two of the most dangerous intersections in Missouri are Diverging Diamond Interchanges, Dorsett Road & I-270 and Front Street and I-435.
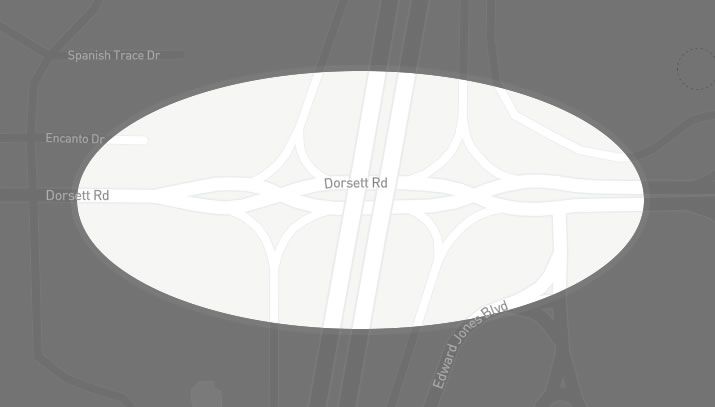
An increasingly popular design in city planning, these roads are intended to help traffic flow, increase safety, limit driver confusion and reduce pedestrian crossing distance. Missouri is one of the leading users of this system; 18 of the 81 DDI roads in the U.S. are in Missouri.
The first of these was installed in Springfield, MO in 2009 at the I-44 and MO Highway 13 intersection. Maryland Heights completed the diverging diamond interchange (DDI) at Dorsett and I-270 in 2011, and it appears drivers have not yet adjusted to it (as this intersection rated as most dangerous in our study).
Increase in Total Injuries and Fatalities in 2015
In 2015, we saw an increase in the total number of injuries and fatalities on Missouri roads. For the purposes of reporting, the Missouri State Highway Patrol classifies injuries as “any person who received a disabling, evident but not disabling, or probable but not apparent injury as a result of a traffic crash.” For fatality numbers, this includes “any crash in which one or more persons were killed as a result of a traffic crash and their death occurred within 30 days of the incident.”
Injuries in Missouri Motor Vehicle Collisions 2010-2015
As you can see in the chart above, after a trend of decreasing injuries for five straight years, the total number rose to the highest total since 2010 when there were 54,893. In total, there were 52,534 injuries from motor vehicle accidents in 2015.
Fatalities in Missouri Motor Vehicle Collisions 2010-2015
Fatalities, just like injuries, also spiked back up in 2015. With a total of 859, this was the highest total number of fatalities since 2009 when there were 878.
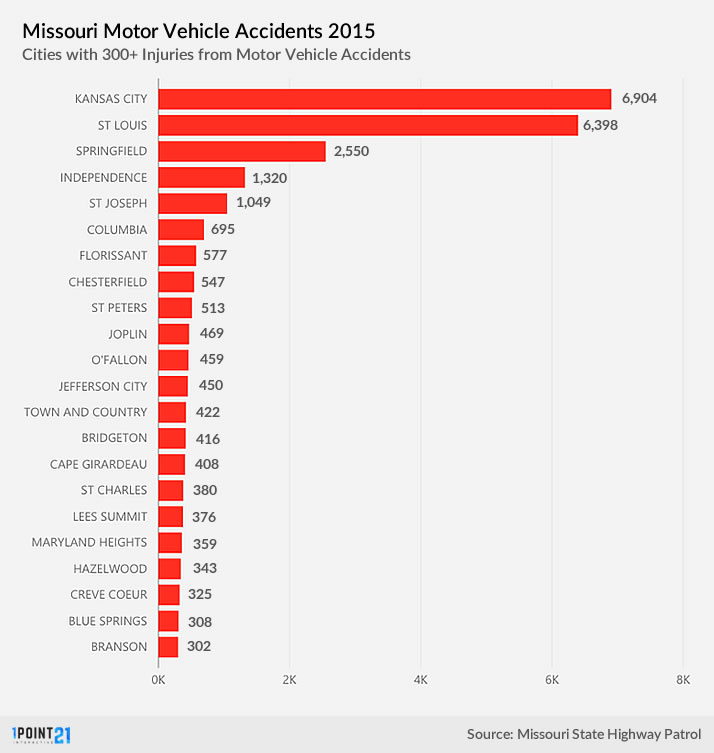
Missouri Cities with Most Accidents
Why We Did This
The overall goal of this analysis is to identify areas of risk for drivers in order to reduce crashes and save lives. It’s up to the drivers using the roads to operate their vehicles safely, but the knowledge of where and when to exercise greater caution can absolutely help. While there are numerous factors that affect the safety of each and every intersection, the trends noted in this study can help identify major problem areas for local government officials to apply their attention. A proactive approach to the most problem intersections in a city could help save lives.
Methodology
We analyzed more than 148,000 collision records to find out where are the most dangerous intersections. Then we assigned the following values to accident, injury and fatality to obtain a danger index score for each intersection.
Formula: Accident (x1) + Injury (x3) + Fatality (x10) = Danger Index
All collision data obtained from the Missouri Department of Transportation (MDOT).